Query History
Data Collage automatically logs every query you run so you can find, review, and rerun past queries without ever copying SQL out of the editor by hand. Whether you want to retry yesterday’s failed query, see how long a particular extract took last week, or recover a one-off SELECT you didn’t think to save — the Query History panel is the first place to look.
What Query History tracks
Section titled “What Query History tracks”For every query run, Data Collage records:
- The SQL text in full
- The connection the query ran against
- The status — success or failure
- The elapsed time (in milliseconds or seconds)
- The row count (for successful runs)
- The error message (for failed runs)
- The timestamp of the run
The panel keeps the 100 most recent queries — older runs roll off automatically as new ones come in.
The history panel
Section titled “The history panel”Open the Query History panel from the activity bar on the left.
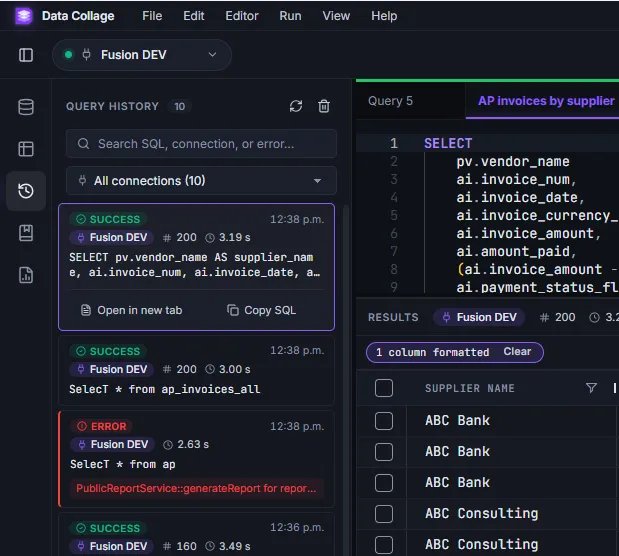
Each row in the panel shows:
| Element | What it tells you |
|---|---|
| Status pill | Green Success or red error status at a glance. |
| Relative timestamp | Today 14:23, Yesterday 09:47, or May 14 11:02 for older runs. |
| Connection chip | Which saved connection the query ran against. |
| Row count | For successful runs only. |
| Elapsed time | How long Fusion took to return the data (850 ms, 2.31 s). |
| SQL preview | The first ~240 characters of the SQL on one line. |
| Error preview | For failed runs, the first line of the error message. |
Searching and filtering
Section titled “Searching and filtering”Search
Section titled “Search”The search box at the top of the panel matches against the SQL text, the connection name, and any error messages — so you can find a past run by whatever detail you remember.
Examples of useful searches:
- A table name you used:
ap_invoices_all - A connection name:
UAT2 - An error keyword:
ORA-00942
Filter by connection
Section titled “Filter by connection”If your history contains queries run against more than one connection, a connection dropdown appears below the search box, with run counts per connection. Pick a connection to scope the list to just runs against that environment. Combine with search for the fastest way to find a specific past run.
Reusing a past query
Section titled “Reusing a past query”Click any row to expand it. Two actions appear:
- Open in new tab — loads the past query’s SQL into a fresh editor tab, ready to rerun.
- Copy SQL — puts the SQL on the clipboard.
This is the recovery path when you wrote a query, ran it, closed the tab, and now wish you’d saved it.
Hover preview
Section titled “Hover preview”Don’t want to expand a row? Hover it. A side tooltip appears showing the full SQL and (for failed runs) the full error message — useful for scanning quickly through many runs to find the one you want.
Reviewing failed runs
Section titled “Reviewing failed runs”Failed queries are visually distinct in the panel — a red status pill instead of green, and a short error snippet below the SQL preview. Combined with the hover tooltip showing the full error message, this is the fastest way to:
- Spot what broke after a working day of running queries
- Re-open a failed query, fix the typo or missing table, and rerun
- Confirm that a query you thought succeeded actually did
Refresh and clear
Section titled “Refresh and clear”Two icons at the top-right of the panel:
- Refresh (circular arrow) — re-pulls the history list. Useful if you’ve been running queries in parallel from another tab or if the panel looks stale.
- Clear (trash) — wipes the entire history with a confirmation prompt. This is not recoverable — once cleared, past entries can’t be brought back inside Data Collage.
Where history lives
Section titled “Where history lives”Query history is stored in Data Collage’s local database on your machine and survives app restarts. It’s per-machine — running a query on your laptop doesn’t appear in the history on your colleague’s machine. There’s no sync to a server.